# Three+ Candle Patterns (Part 1)
In candlestick analysis, **Three+ Candle Patterns** are powerful signals that require three or more candlesticks to confirm a potential market reversal. These patterns provide deeper context and are considered more reliable due to the combination of multiple price actions.
Below, we explore some of the most important multi-candle patterns, both **bullish** and **bearish**.
## 🔼 Bullish Patterns
### 1. Morning Star
The Morning Star is a strong bullish reversal pattern that appears after a downtrend. It consists of:
* A long bearish candle
* A small-bodied candle (can be bullish or bearish), signaling indecision
* A long bullish candle confirming the reversal
🔍 **Key Feature**: *It shows the shift from seller dominance to buyer control*.
### 2. Morning Doji Star
A variation of the Morning Star, where the middle candle is a **Doji** instead of a small real body.
🌀 **Why it matters**: *The Doji adds more significance to the indecision phase, strengthening the likelihood of a bullish reversal*.
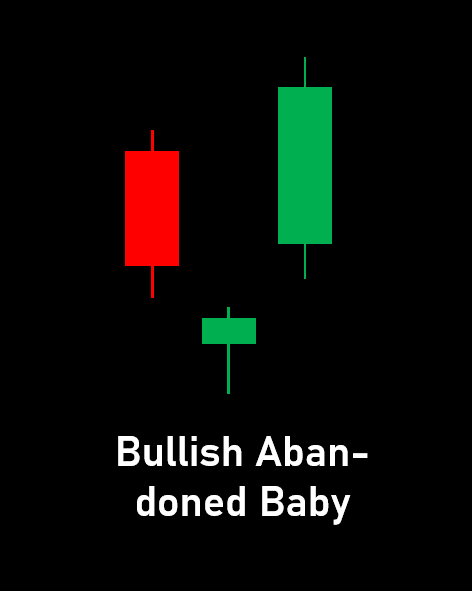
### 3. Bullish Abandoned Baby
A rare but strong pattern with:
* A long bearish candle
* A Doji that “gaps down” (no overlap with previous or next candle)
* A long bullish candle that gaps up
🧠 **Interpretation**: *It suggests a complete loss of bearish momentum, followed by a surge in buying pressure*.
## 🔽 Bearish Patterns
### 1. Evening Star
The bearish counterpart to the Morning Star, forming after an uptrend:
* A long bullish candle
* A small-bodied candle (signaling hesitation)
* A long bearish candle that closes below the midpoint of the first
⚠️ **Signal**: *A clear warning of potential reversal to the downside*.
### 2. Evening Doji Star
This pattern replaces the second candle with a **Doji**, just like the Morning Doji Star.
💡 **Takeaway**: *The Doji emphasizes the market’s uncertainty before the selling pressure takes over*.
### 3. Bearish Abandoned Baby
A reversal setup after an uptrend:
* A bullish candle
* A Doji gapping above previous highs
* A strong bearish candle gapping below the Doji
🚨 **Why it’s powerful**: *The gapped Doji creates psychological panic, leading to a sharp reversal*.
Three+ candle patterns are not just about individual candles — they tell a **story of market sentiment** over time. When used with volume, support/resistance levels, and confirmations, they become powerful tools in any trader’s strategy arsenal.