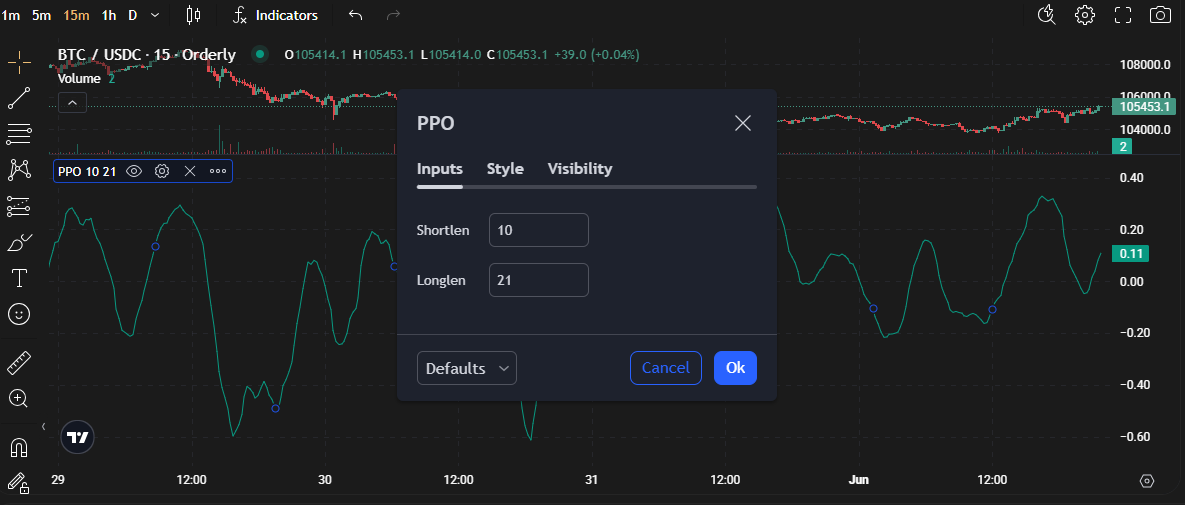
# Price Oscillator
## 🔍 What is the Price Oscillator?
The Price Oscillator is a momentum-based technical indicator that measures the difference between two moving averages of a security’s price. It is designed to show both the direction and strength of a trend by highlighting the convergence and divergence between short-term and long-term price movements.
The Price Oscillator is closely related to the MACD (Moving Average Convergence Divergence) but differs in that it is typically plotted as a percentage rather than an absolute value. This makes it particularly useful for comparing performance across different assets and timeframes.
## ⚙️ How It Works
The Price Oscillator is calculated by subtracting a longer-period moving average from a shorter-period moving average. The result can be expressed either as a raw difference or as a percentage of the longer-term moving average:
* **Raw Formula (This is the one used in VOOI):**\
`Price Oscillator = Short-term MA – Long-term MA`
* **Percentage Formula (Common):**\
`Price Oscillator % = ((Short-term MA – Long-term MA) / Long-term MA) * 100`
The output is a line that oscillates above and below a zero line. When the oscillator is above zero, it suggests upward momentum, while values below zero suggest downward momentum.
## 📖 How to Read It
* **Above Zero:** Indicates bullish momentum. The short-term price is above the long-term average, suggesting upward movement.
* **Below Zero:** Indicates bearish momentum. The short-term price is below the long-term average, suggesting downward movement.
* **Crossing the Zero Line:** A potential signal of a trend reversal or confirmation of momentum.
* **Peaks and Troughs:** Extreme highs or lows may signal overbought or oversold conditions, although this is best used with other indicators.
## ⚙️ Best Settings
The default settings typically used in most platforms are:
* **Short-term MA:** 10-period EMA or SMA
* **Long-term MA:** 20-period EMA or SMA
However, traders can adjust these parameters based on their trading style and timeframe:
* **Day traders:** May use 5- and 13-period averages for quicker signals.
* **Swing traders:** Often prefer 10- and 30-period combinations.
* **Long-term investors:** Might use 50- and 200-period averages to capture major trends.
## 🧠 How to Use It in a Strategy
#### 1. **Trend Identification**
Use the oscillator to determine the prevailing trend:
* If the oscillator stays above zero for a prolonged time, the market is likely in an uptrend.
* If it remains below zero, a downtrend is in place.
#### 2. **Crossover Signals**
Buy and sell signals are generated when the oscillator crosses the zero line:
* **Buy Signal:** When the oscillator moves from below to above zero.
* **Sell Signal:** When the oscillator moves from above to below zero.
#### 3. **Divergences**
Look for divergences between the Price Oscillator and the price action:
* **Bullish Divergence:** Price makes a lower low, but the oscillator makes a higher low.
* **Bearish Divergence:** Price makes a higher high, but the oscillator makes a lower high.
#### 4. **Combination with Other Indicators**
Combine with RSI, MACD, or volume indicators for stronger confirmations and to avoid false signals.
## ⚠️ Common Mistakes
* **Using in Isolation:** Relying solely on the Price Oscillator without confirming signals from other indicators can lead to false trades.
* **Overreacting to Noise:** On shorter timeframes, the oscillator may give many signals due to market noise.
* **Misinterpreting Divergences:** Divergences don’t always lead to reversals and should be confirmed with price action or volume.
## 🧠 Final Thoughts
The Price Oscillator is a powerful yet straightforward tool for identifying momentum and trend direction. Its simplicity makes it ideal for both beginner and experienced traders, especially when combined with other forms of technical analysis.
However, as with any indicator, it’s not infallible. Understanding market context, risk management, and confirmation from other tools is crucial to effectively applying the Price Oscillator in real trading scenarios.