VOOI Academy
  • VOOI Academy: Home
  • Candlestick Analysis
    • Candle Patterns
      • One-Candle Patterns
      • Two-Candle Patterns
      • Three+ Candle Patterns (Part 1)
      • Three+ Candle Patterns (Part 2)
  • 📈 Trading strategies
    • 🛡️ Strategy basics
      • Swing Trading: A Beginner-Friendly Guide
      • Zero-Cost Collar: What It Is and How It Works
      • Calendar Spread: What It Is and How It Works
    • 🧠 Introduction to Trading Psychology and Risk Management
      • Trading Psychology
      • Risk Management
      • Decision-Making Under Uncertainty in Trading
      • Handling Losses & Drawdowns in Trading
      • Developing Discipline & Patience in Trading
    • 📊 Indicators & Tools
      • MA Cross
      • Relative Strength Index (RSI)
      • Accelerator Oscillator (AC)
      • Accumulation/Distribution (A/D) Indicator
      • Accumulative Swing Index (ASI)
      • Advance/Decline Line (A/D Line)
      • Arnaud Legoux Moving Average (ALMA)
      • Aroon Indicator
      • Average Directional Index (ADX)
      • Average Price Indicator
      • Average True Range (ATR)
      • Awesome Oscillator (AO)
      • Balance of Power (BOP)
      • Bollinger Bands
      • Chaikin Money Flow (CMF)
      • Chaikin Oscillator
      • Chaikin Volatility (CV)
      • Chande Kroll Stop
      • Chande Momentum Oscillator (CMO)
      • Chop Zone Indicator
      • Choppiness Index
      • Commodity Channel Index (CCI)
      • Connors RSI: A Powerful Twist on a Classic Indicator
      • Coppock Curve: A Momentum Indicator with Long-Term Vision
      • Correlation – Log: Understanding Market Relationships with Precision
      • Correlation Coefficient Indicator: Understanding Asset Relationships
      • Detrended Price Oscillator (DPO)
      • Directional Movement (DMI)
      • Donchian Channel: Trend Clarity with Simplicity
      • Double Exponential Moving Average (DEMA)
      • Ease Of Movement (EOM)
      • Elder’s Force Index (EFI)
      • Envelopes Indicator
      • Fisher Transform
      • Guppy Multiple Moving Average (GMMA)
      • Historical Volatility (HV)
      • Hull Moving Average (HMA)
      • Ichimoku Cloud
      • Keltner Channels
      • Klinger Oscillator
      • Know Sure Thing (KST)
      • Least Squares Moving Average (LSMA)
      • Linear Regression Curve
      • Linear Regression Slope
  • Automated Trading
    • Automated Trading vs. Manual Trading
    • Choosing the Right Strategy for Automated Trading
    • Alerts and their importance in automated trading
    • Connecting alerts using API keys
    • Setting up a trading bot for VOOI
  • VOOI
Powered by GitBook
On this page
  • 🔍 What Is It?
  • ⚙️ How It Works
  • 📖 How to Read It
  • 🔧 Best Settings
  • 📊 How to Use It in a Strategy
  • ⚠️ Common Mistakes
  • 🧠 Final Thoughts
  1. 📈 Trading strategies
  2. 📊 Indicators & Tools

Directional Movement (DMI)

PreviousDetrended Price Oscillator (DPO)NextDonchian Channel: Trend Clarity with Simplicity

Last updated 11 days ago

🔍 What Is It?

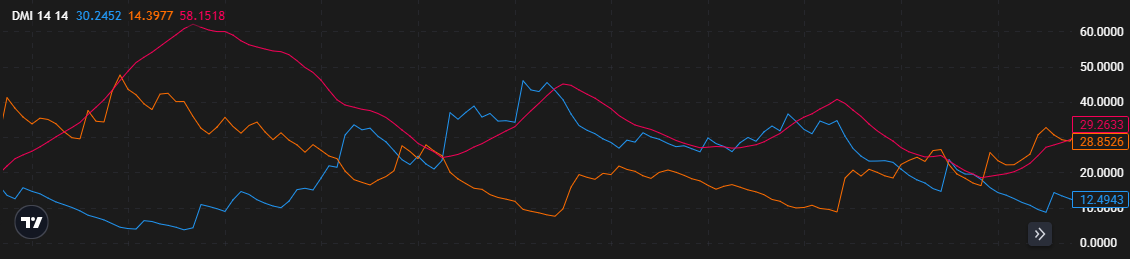
The Directional Movement Indicator (DMI), developed by J. Welles Wilder Jr., is a trend-following system that identifies the strength and direction of a trend. It’s composed of three components:

  • +DI (Positive Directional Indicator)

  • −DI (Negative Directional Indicator)

  • ADX (Average Directional Index) — often used in conjunction with DMI

While ADX shows the strength of the trend, +DI and -DI tell you the direction: which side is currently in control — bulls or bears.

⚙️ How It Works

DMI compares the difference between highs and lows of consecutive price bars to determine directional strength.

  • +DI measures how strongly price moved upward compared to the previous bar

  • −DI measures how strongly price moved downward

The lines are then smoothed using a moving average to reduce noise.

If +DI is above -DI, it suggests upward movement is stronger. If -DI is above +DI, it implies sellers have control.

📖 How to Read It

The relationship between the two lines gives directional bias:

  • 🔼 +DI > -DI = Bullish trend

  • 🔽 -DI > +DI = Bearish trend

  • 🔁 Crossovers of the two lines can signal trend shifts:

    • When +DI crosses above -DI → Buy signal

    • When -DI crosses above +DI → Sell signal

To improve accuracy, traders often combine DMI with the ADX:

  • ADX > 20-25 = Trending market

  • ADX < 20 = Weak or range-bound market

🔧 Best Settings

  • ✅ Period: 14 (default by Wilder)

  • 📈 Timeframes: Works well on higher timeframes like 1H, 4H, and Daily

  • 🔍 Asset types: Can be applied to crypto, forex, or stocks

Pro tip: Test custom settings based on asset volatility.

📊 How to Use It in a Strategy

Here’s a practical way to use DMI:

Trend Confirmation:

  • If +DI > -DI and ADX is rising above 25 → Strong uptrend

  • If -DI > +DI and ADX is rising above 25 → Strong downtrend You can enter in the direction of the trend after a pullback.

Cross Trading:

  • Enter long when +DI crosses above -DI and ADX > 20

  • Enter short when -DI crosses above +DI and ADX > 20

Combine with:

  • Moving Averages to define support/resistance

  • Candlestick patterns to time entries more precisely

⚠️ Common Mistakes

  • ❌ Ignoring ADX — DI crossovers alone can give false signals

  • ❌ Using on low timeframes where noise dominates

  • ❌ Over-relying on DMI without broader market context

Always combine it with price action or volume indicators for better decisions.

🧠 Final Thoughts

Directional Movement is a powerful trend-following tool, but it shines best when:

  • Combined with ADX

  • Used on higher timeframes

  • Paired with a broader strategy

It helps you avoid choppy markets and jump on confirmed trends — whether you're trading BTC, gold, or SPX.